17/04/2020 -
A few weeks after the publication of the platform, PandemicData's results are
more than good, and we are extremely satisfied with the success.
The software - which allows intuitive comparisons on daily data related to the Coronavirus pandemic in Italy and in the world - is available online at this link
PandemicData.info
and has received visits from all over the world.
The number of users - scattered all over the globe - is the first important result we feel we have achieved: the dissemination of the platform took place almost completely spontaneously, without advertising or articulated information channels, through a word of mouth and some google searches.
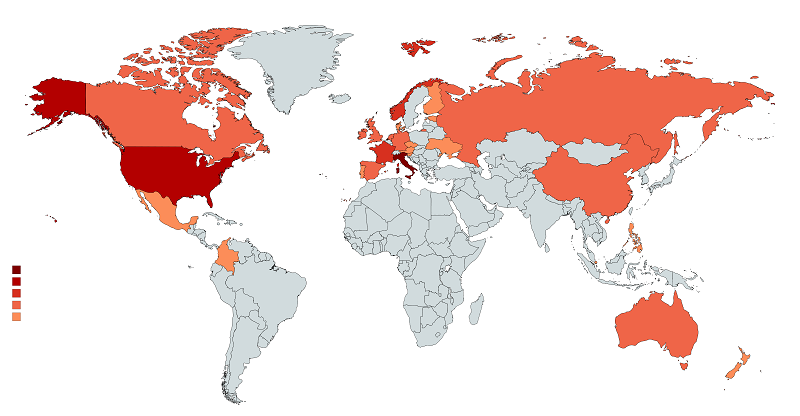
PandemicData users around the world
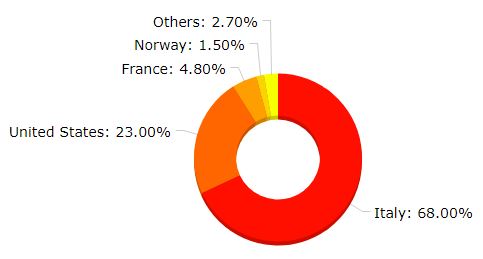
The countries reached are more than 30, on all continents; the concentration of users, however, is very unbalanced towards Italy and the United States. These are the countries with the highest number of visitors, followed by a complete list of the countries in which it was registered a consistent number of users.
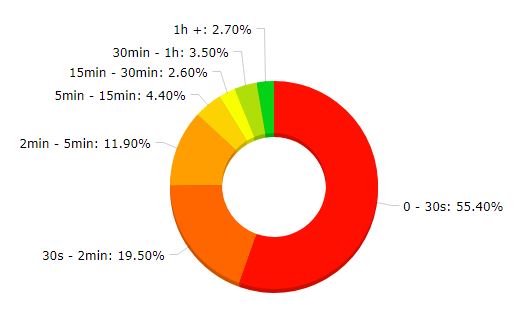
The data collected on traffic shows a pool of users not only scattered in many geographical areas, but also particularly interested and active. Many users (about 50%) decide to stay on the platform for a period of more than 30 seconds, which means that about half of the people who open the platform takes the time to understand how this works or for use it by activating some charts. The percentages of users who have undertaken sessions of different durations are shown below.
Another important index of the interest shown by users and their interactivity is the relationship between visits and visitors: from this data it emerges that many users return - after some time or immediately - to visit the platform to consult it again. In detail, from the data collected by the server it is possible to estimate very precisely that the average number of visits per user is 1.54 .
A very similar data can be obtained by comparing the number of hits on the platform to the number of visitors, or similarly the number of pages viewed to the number of visitors. These values are summarized in the following table.
Finally - regarding traffic analysis - it may be interesting to observe how traffic and users are divided between the 3 pages that basically make up the software ("In Italia", "Nel Mondo", "Credits & Info").
If the first goal achieved lies in the number of users we have reached, the other is the feedback we have having regard to the concrete usefulness of the platform. The software - in fact - has not only been used by thousands of users for purely information purposes, but it has served authorities and official offices as a tool for data analysis for meetings and press conferences.
The collaboration with the Trentino "Protezione Civile" is certainly important: our platform was useful for their officers, which suggested also some changes or implementations that would improve its use in their activities.
The software - which allows intuitive comparisons on daily data related to the Coronavirus pandemic in Italy and in the world - is available online at this link
and has received visits from all over the world.
The number of users - scattered all over the globe - is the first important result we feel we have achieved: the dissemination of the platform took place almost completely spontaneously, without advertising or articulated information channels, through a word of mouth and some google searches.
PandemicData users around the world
The countries reached are more than 30, on all continents; the concentration of users, however, is very unbalanced towards Italy and the United States. These are the countries with the highest number of visitors, followed by a complete list of the countries in which it was registered a consistent number of users.
| 1 | Italy | 13 | Finland |
|---|---|---|---|
| 2 | United States | 14 | Austria |
| 3 | France | 15 | Denmark |
| 4 | Norway | 16 | Ireland |
| 5 | Great Britain | 17 | Romania |
| 6 | Canada | 18 | Poland |
| 7 | Russian Federation | 19 | Philippines |
| 8 | Germany | 20 | Portugal |
| 9 | Netherlands | 21 | New Zealand |
| 10 | Spain | 22 | Estonia |
| 11 | India | 23 | Slovenia |
| 12 | Australia | 24 | Venezuela |
The data collected on traffic shows a pool of users not only scattered in many geographical areas, but also particularly interested and active. Many users (about 50%) decide to stay on the platform for a period of more than 30 seconds, which means that about half of the people who open the platform takes the time to understand how this works or for use it by activating some charts. The percentages of users who have undertaken sessions of different durations are shown below.
Another important index of the interest shown by users and their interactivity is the relationship between visits and visitors: from this data it emerges that many users return - after some time or immediately - to visit the platform to consult it again. In detail, from the data collected by the server it is possible to estimate very precisely that the average number of visits per user is 1.54 .
A very similar data can be obtained by comparing the number of hits on the platform to the number of visitors, or similarly the number of pages viewed to the number of visitors. These values are summarized in the following table.
| Visits / User | 1,54 |
| Pages viewed / Visit | 4,8 |
| Pages viewed / User | 7,4 |
| Hits / Visit | 20,2 |
| Hits / User | 31,3 |
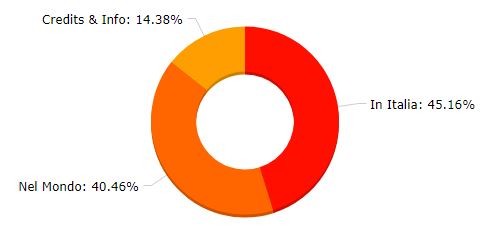
Finally - regarding traffic analysis - it may be interesting to observe how traffic and users are divided between the 3 pages that basically make up the software ("In Italia", "Nel Mondo", "Credits & Info").
If the first goal achieved lies in the number of users we have reached, the other is the feedback we have having regard to the concrete usefulness of the platform. The software - in fact - has not only been used by thousands of users for purely information purposes, but it has served authorities and official offices as a tool for data analysis for meetings and press conferences.
The collaboration with the Trentino "Protezione Civile" is certainly important: our platform was useful for their officers, which suggested also some changes or implementations that would improve its use in their activities.